Food Cost Basics
By Joe Dunbar
Several people have emailed me in the past few months asking how to calculate their food cost percentage. In addition, many people have asked me for an industry benchmark for food cost percentage. While the food cost formula is straight forward, it may be impossible to arrive at a true industry benchmark percentage. There are far too many industry segments with unique cost characteristics.
Let’s start with the basic food cost percentage formula: FC% = (BI+P-EI)/S
FC%: Food Cost Percentage BI: Beginning Food Inventory P: Purchases
EI: Ending Food Inventory
S: Food Sales
It is absolutely necessary to use the same dates for sales and purchase activity. You need to take the inventory after all sales activity has ceased (either late at night or early in the morning). There should be no deliveries during your inventory.
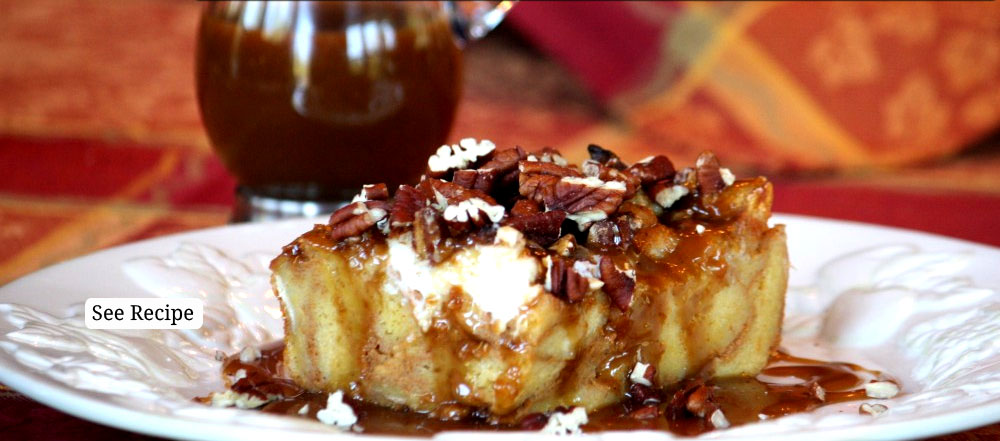
Everyone has a personal preference for valuing the inventory. Traditionally, food service managers used the most recent cost paid for each item to value the ending inventory. Most people still follow this method which closely approximates FIFO. If you are concerned about the freshness of any food in storage, I’d recommend a zero value. For example, stale bread is not worth the same as a fresh loaf (but it can be used in stuffing and French Toast).
Regarding food cost percentage benchmarks, try to get a feel for the industry segment closest to your business model. There are public companies in almost every segment. In general, the faster the service the lower the food cost percentage. QSR operators experience food cost figures below 30% and four star fine dining operators typically approach 40%. Operations in urban areas run lower food cost percentages to allow for the higher rents. If you raise your selling prices to cover higher occupancy costs, you should see your percentage dip.
Many family run businesses operate in premises with no rent and no mortgage. Although I learned food cost percentages should stay below 35%, I have seen many successful family run businesses run above this number.

Food Cost – Beyond Basic
By Joe Dunbar
In last week’s article Food Cost Basics , I outlined the traditional formula for calculating food cost percentage.
At the heart of the formula you will find the simple food cost calculation: FC=P+(BI-EI). Twisting this formula slightly, we find food cost equal to our purchases plus or minus the change in inventory value:
FC=P+(BI-EI).
As your period of time increases between inventories, the purchases will become more dominant than the inventory change. On the other hand, inventory change is a huge factor in operations with daily inventory counts.
In my college days, I worked for a major fast food operation and my duties included a daily inventory of all food, beverages and paper products. We calculated a daily food cost percentage. Whenever my costs were out of line, I reviewed the inventory valuations carefully. Often, the variance could be traced to a low cost item incorrectly extended by a high price. There were many times a pricey item was extended at a fraction of the cost. Once these corrections were made it was possible to see the true picture of results.
Many operators have many more items than the 120 I tracked each day. Also, I doubt their managers are paid $160 each week and scheduled 7 days a week for 10 hours a day. Casual dining concepts often require inventories with over 1,000 items. The daily inventory calculation would be cost prohibitive.
Let’s examine the formula in finer detail. The total food cost is equal to the sum of the individual item food costs. If you have 800 items to count, the food cost formula could be expressed as follows:
So for each item in your inventory, you add beginning inventory to purchases and subtract ending inventory. Your total food cost figure is the sum of all these numbers.
If you run these numbers on a spreadsheet, I recommend you sort the matrix in descending order using the extension column. Count the inventory every day for the top 10 items on the page. Calculate the cost of these 10 items each day. I believe you will find the cost of these 10 items (as a percent of sales)
will provide you with answers to many of your food cost issues. You may want to increase the number of items tracked to 25 if you have a very diverse menu.
When the accounting department tells you the percentage is up two tenths in the past month, you will know why the cost increased. Analyze the major items and move beyond basic cost calculation.
Effective Food Cost Control
It is very important to use clear, properly prepared reports to analyze food cost results. Often, the reports become the focal point due to errors and omissions. Once the report has lost credibility, a meaningful discussion of operational issues is difficult.
A properly prepared food cost report should have a brief summary at the top of the page. Basic operating statistics should be highlighted. We need to know the period of time (week, month, quarter or year) and the ending date. Operating results should include the period sales and purchases, beginning and ending inventory values, food cost and the food cost percentage.
Supporting the summary information, you should include a recap of purchases, inventories and cost of sales by category (e.g. meat, seafood, produce, etc.). I prefer to show these category totals as a percentage of total food cost rather than as a percentage of sales. This report section should highlight how we spend our purchase dollar.
Finally, a comparison with previous periods is very helpful. Budget comparisons are useful as well if the budgets were thoughtfully prepared. Try to put the current period in context. Show how well the performance was compared to other benchmark periods (e.g. previous month, last year, current year budget, etc.). The comparison section should show in which direction the operation is headed.
Supporting the management summary page, insights and concerns regarding specific components need to be reported. For example, if there was significant waste due to spoilage of produce, the purchasing manager can concentrate on ordering fewer cases (or splitting cases if necessary). Rising prices of gas and corn has impacted the cost of many commodities. Calculate the impact of your meat and dairy price increases on net profits. Bring any other significant findings to management’s attention.
Joe Dunbar
Dunbar Associates
P.O. Box 579
Fairfax, VA 22038-0579 800-949-3295 http://www.joedunbar.com jdunbar401@aol.com


 in <b>/var/www/vhosts/cooksandeats.com/httpdocs/wp-content/themes/CooksandEats/sidebar.php</b> on line <b>1</b><br />
/wp-content/themes/CooksandEats/images/side-logo.png)


 in <b>/var/www/vhosts/cooksandeats.com/httpdocs/wp-content/themes/CooksandEats/footer.php</b> on line <b>13</b><br />
/wp-content/themes/CooksandEats/images/back-to-top.png)